

Poorer Power to the People: Nigeria’s Politics of Population, Presumption and Privation (2)
Poorer Power to the People: Nigeria’s Politics of Population, Presumption and Privation (2)

Census and demographic data are not only falsified to acquire undeserved numbers of federal and state legislative seats. The purported numbers are also used to sway election outcomes in the interest of a false majority that decides Nigeria’s Presidents.
The Nigerian President handles 53% of the country’s revenues and chooses the individuals who stash away, share and supervise the country’s vast visible and veiled resources.
These enormous powers of the central federal government fuel the people’s presumption that having a person from their state, region, ethnicity or religion as the President would fast-track the infrastructural development and economic growth of their people.
Data consistently debunks this myth.
Yet, when it comes to the 133 million multidimensionally poor people in Nigeria, this much is clear in the scheme of revenue distribution:
40% of the scarce financial resources allocated to states is based on clearly unequal equality.
30% of the same is shared, prioritising the more populous states and local governments over the less populated ones.
An unequal contribution of IGR by each state but an equal distribution of the IGR pool among states discourages collection and full disclosure of IGR by states with high IGRs.
Indeed, the Nigerian variant of the politics of population fosters two more presumptions that increase the people’s privation, namely, federal might and federal allocation.
Federal might and poverty
Harping the power of the population for election victories rather than the pertinence of productivity for economic well-being comes with dire consequences.
This sits on the myth that the most populous people determine the person and path of the federal government and, as such, derive the highest returns from the federal government.
Yet, the poorest states in the country are the states that produced the heads of the federal government, especially after the end of the Civil War in 1966.

All the states that produced Nigeria’s heads of state or Presidents since 1967 all have their multidimensional poverty indices (MPIs) below the national average of 25.7% or 0.257.
With regards to multidimensional poverty:
Sokoto, President Shagari’s home state, is the worst in the Northwest region.
Bayelsa, President Goodluck’s state, is the worst in the South-south region.
Ogun, Presidents Shonekan and Obasanjo’s home state, is the worst in the Southwest region, and
Plateau, the home state of heads of state General Gowon and Muritala, is the worst in the North Central region.
Kano, the home state of the head of state General Abacha ranks worse than the national average poor state.
Niger, the home state of the heads of state General Babangida and Abubakar, ranks worse than the national average poor state.
Katsina, Presidents Yaradua and Buhari’s home state, ranks worse than the national average poor state.
These states also have the worst poverty prevalence in their geopolitical regions.

The people (their numbers inflated and juveniles inserted) are further schooled to vote for selected candidates, whether they are competent or not, and promised nepotistic benefits. But data shows that the people never benefit from these nepotistic promises, whether the leaders are military dictators or civilian autocrats.
Though a few of the less privileged are financially empowered and strategically positioned to serve the sectional elite interest, the majority of the people are left high and dry.
Federal allocation and poverty
Nigeria’s federal revenue-sharing formula is not only vertically lopsided between the three tiers of government but also horizontally skewed to reward states and local governments with greater populations.
Yet, the poorest states in the country are those same populous states.
Fundamentally, there are two components of the revenue allocation formula used for the disbursement of the Federation Account to the three tiers of government, according to the National Bureau of Statistics (NBS). These are:
The Vertical Allocation Formula (VAF)
Horizontal Allocation Formula (HAF)
The NBS details the two resource allocation metrics further:
The Vertical Allocation Formula
This formula shows the percentage allocated to the three tiers of government, i.e. federal, state, and local governments. This formula is applied vertically to the total volume of disbursable revenue in the Federation Account at a particular point in time. The VAF allows every tier of government to know what is due to it; the Federal Government on (the) one hand and the 36 States and the FCT and 774 Local Governments on the other.

The current vertical allocation formula on the net federation account revenue distributable (i.e., after statutory deductions such as 13% derivation and other charges and costs and excluding VAT) is as follows:
1 central Federal Government has 52.68%
(This is further divided into general ecological problems (1%), Federal Capital Territory (1%), Development of natural resources (1.68%), statutory stabilisation (0.5%), and the balance of 48.5% for the Federal Government).
36 State Governments share 26.72%.
774 Local Government share 20.60%.
In addition to the federation account distributable revenue above, there is also a separate sharing ratio for Value Added Tax in which the Federal gets 15%, States share 50%, and Local Governments share the balance of 35%.
Thus, it can conveniently be concluded that the vertical allocation formula is for inter-tier sharing between the three tiers of government, while the horizontal allocation formula is for intra-tier sharing amongst the 36 States and the 774 Local Governments in Nigeria.
The Horizontal Allocation Formula
The formula applies to States and Local Governments only. It provides the basis for sharing the volume of revenue already allocated to the 36 States and 774 Local Governments. By applying the principles of the horizontal allocation formula, the allocation due to each State or Local Government is determined.
On the other hand, the horizontal allocation formula, which is more for the States and Local governments and accordingly captures factors/principles and percentages, is as follows:
Equality – 40%. Here 40% of disbursable revenue from the share of the States’ 26.72% from the Federation Account is divided equally across all 36 States.
The remaining 60% of the 26.72% of the State's share of the Federation account is disbursed as follows:
Population – 30%. Here 30% of State's share of 26.72% is shared, dependent on each State's share of total population as determined by the National Population Commission.

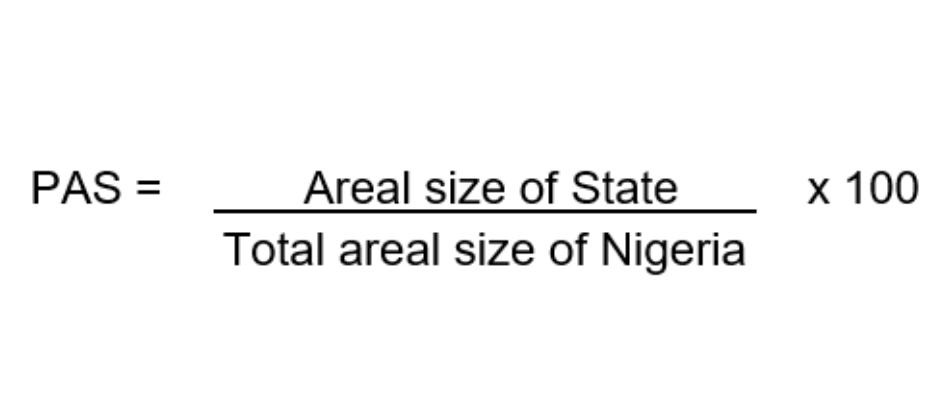
Landmass/Terrain – 10%. The land mass of a State or local government shall be the proportional areal size (PAS) of the State or the local government to the total areal size of Nigeria, and shall be obtained as follows:

The allocation due to terrain is made based on the proportional areal size of the three identified major terrain types present in the State or Local Government area, respectively, which are:
(i) wetlands / waterbodies;
(ii) plains; and
(iii) highlands;
Internally Generated Revenue (IGR) – 10%. Each State is mandated to contribute 10% of its IGR into a joint State and Local Government account to be shared equally.
Just as a 10% weight is given to land mass, the IGR of a state carries an equally low weight compared to the population.

This revenue and resource allocation formula ensures that an unproductive but populous state would be awarded an equal IGR share with others. In many instances, this state is allocated more gross revenue than a productive but fewer population.
Nigeria’s variant politics of population then encourages reproduction than resourcefulness, a value that comes with basic education, skill acquisition, and planned parenthood. This is sheer presumption and only plunges the people deeper into avoidable mass privation.
As earlier observed, “The presumptuous power of numbers describes a people who continue to reproduce, rear and rely on an uneducated, miseducated, obsolete, aimless mass population to win votes and perpetuate their political clout.”
Social Development Factor – 10%. This comprises Education (4%), Health (3.0%), and Water (3.0%).
In determining the allocation for a state, the social development factor is given an equally low weight of 10% compared to the 30% weight for population.
Education as a parameter for allocation to Social Development Factor (SDF) relates to primary school enrolment, which attracts 60 per cent of the allocation to education. In comparison, the remaining 40 per cent is made using secondary school enrolment.
Allocation based on primary school enrolment is made solely in direct proportion to school enrollment.
However, 50 per cent of the allocation based on secondary school enrolment is made in direct proportion to school enrollment. The remaining 50 per cent is made in inverse proportion to school enrollment. School enrolment refers to publicly funded schools only.
Health as a parameter for allocation to social development factors relates to the number of State/Local Government hospital beds, and 50 per cent of the allocation to health is made in direct proportion to the number of State hospital beds. The remaining 50 per cent is made in inverse proportion to the number of State hospital beds.
Water as a parameter for allocation to social development factor shall be represented by mean annual rainfall in the State headquarters, and territorial spread of the State - 50 per cent of the allocation to water shall be made in direct proportion to the State's territorial spread. The remaining 50 per cent shall be made in inverse proportion to the mean annual rainfall in each State headquarters, using the most current live year figures, the same year for all the States.
In essence, the current discretionary revenue allocation formula creates disincentives for citizens' economic agency, incentives for unbridled population growth, and an ever-increasing poor and obsolete population.
Overall, the Nigerian variant of the politics of population is seen to be the single driver of the country’s fiscal inequities, factionalised elite, and failing poverty alleviation initiatives.
Plateau is the home state of General Yakubu Gowon but not the home state of General Murtala as stated in this very interesting and revealing piece.